German day-ahead power prices through Kafka, Spark Structured Streaming and Apache Iceberg, orchestrated with Airflow and served with PostgreSQL and Grafana. Rebuilt daily; generated 2026-10-18 16:40 UTC.
Repository · README · Operations runbook · Findings
Part of a three-project portfolio: de-energy-streaming · nl-energy-warehouse · databricks-energy-quality.
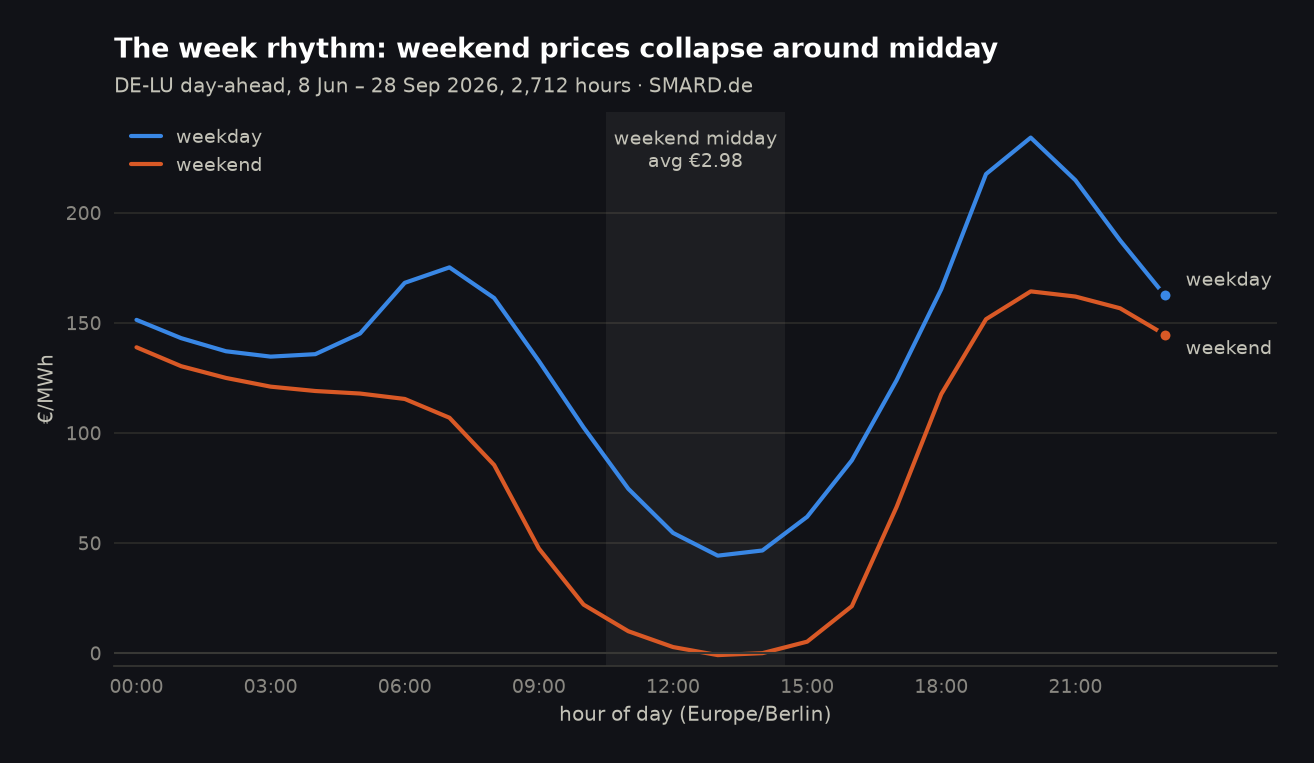
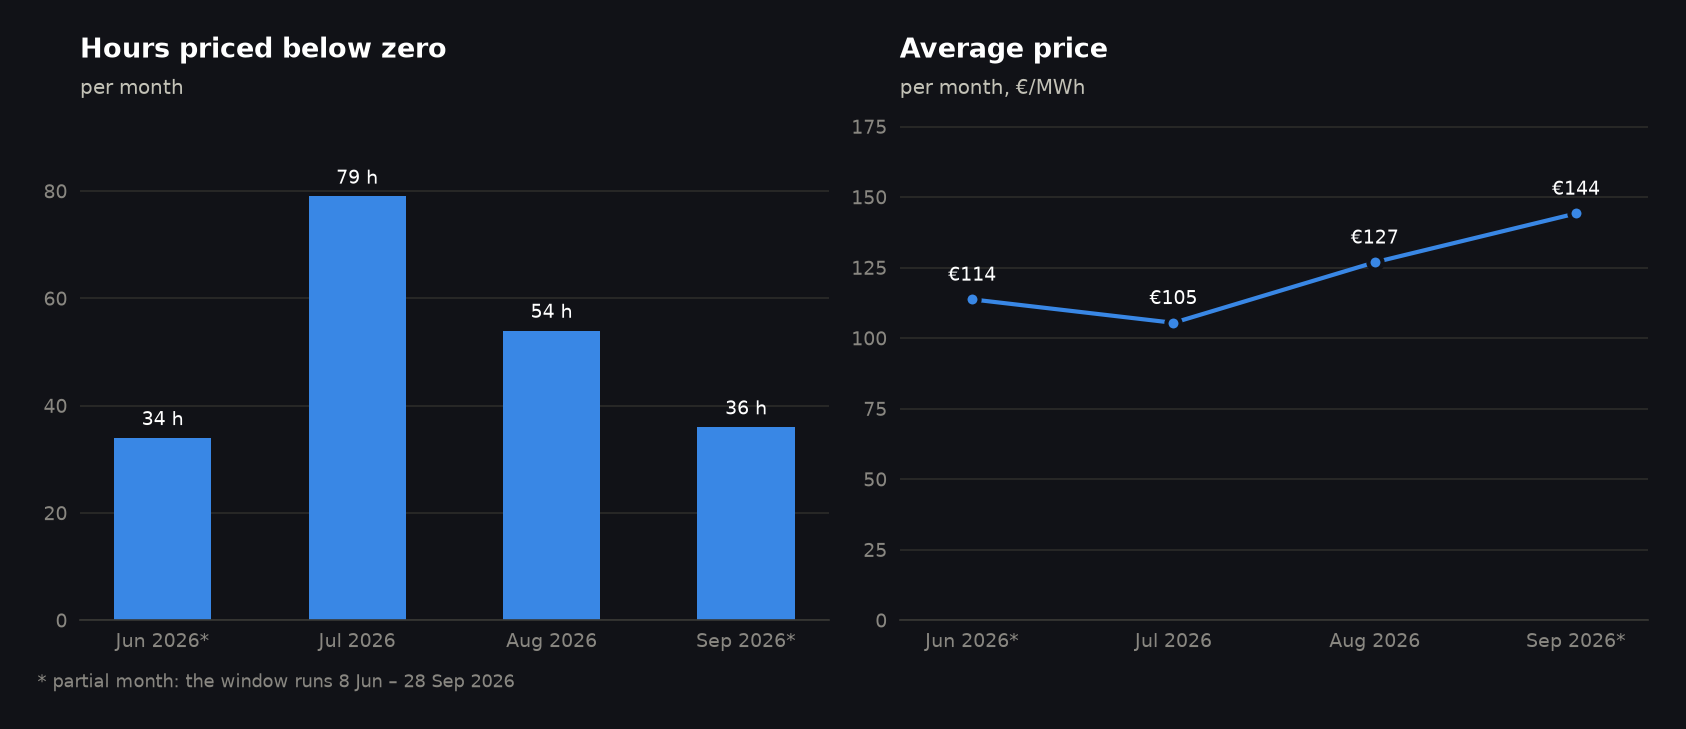
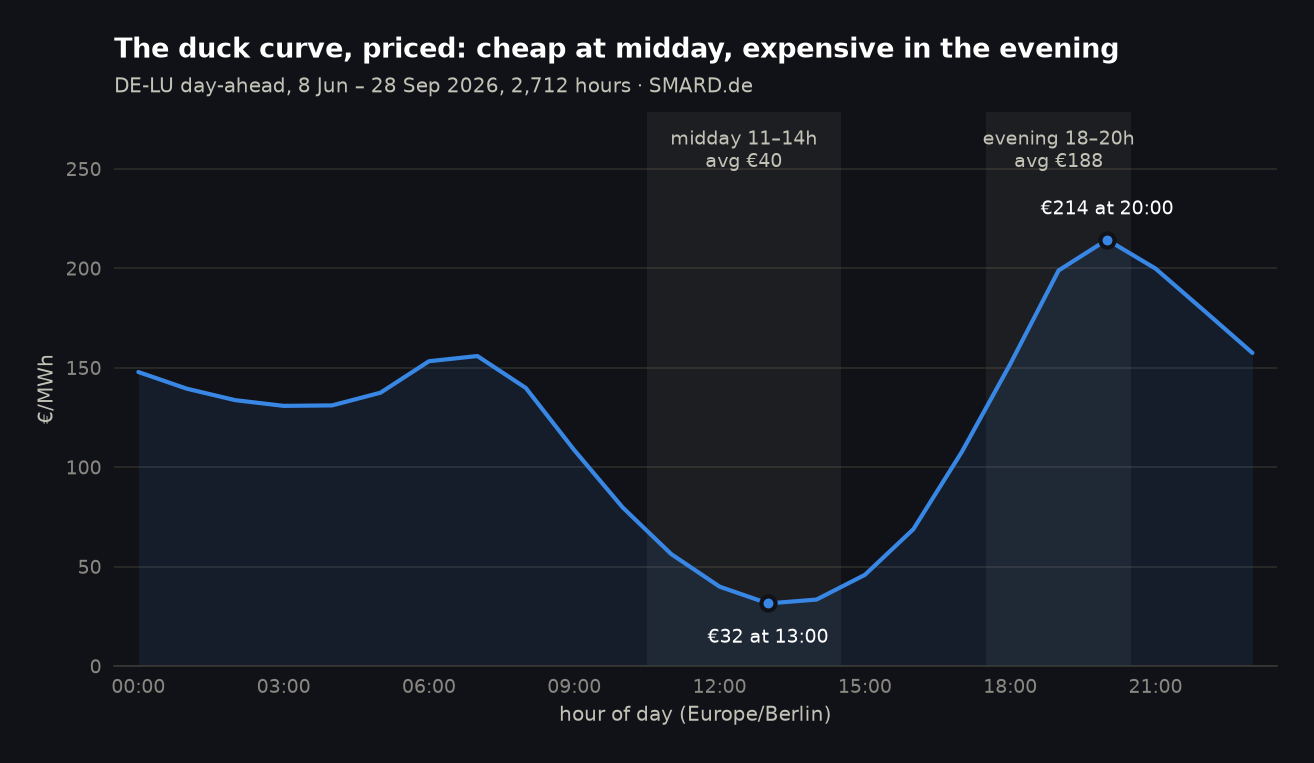
Computed from the marts, 8 June – 28 September 2026. Full analysis and caveats: findings.md.
flowchart TB
    SMARD["SMARD.de"] -->|live poll / replay| P["producer (Python)"]
    P -->|keyed JSON| K[("Redpanda (Kafka API)")]
    K --> S["Spark Structured Streaming"]
    S -->|"MERGE, newest revision wins"| B[("Iceberg bronze (S3 API, LocalStack)")]
    S -->|malformed records| D[("DLQ topic")]
    B --> T["Spark batch transform"]
    T --> SI[("Iceberg silver + gold")]
    T -->|upsert| PG[("Postgres serving")]
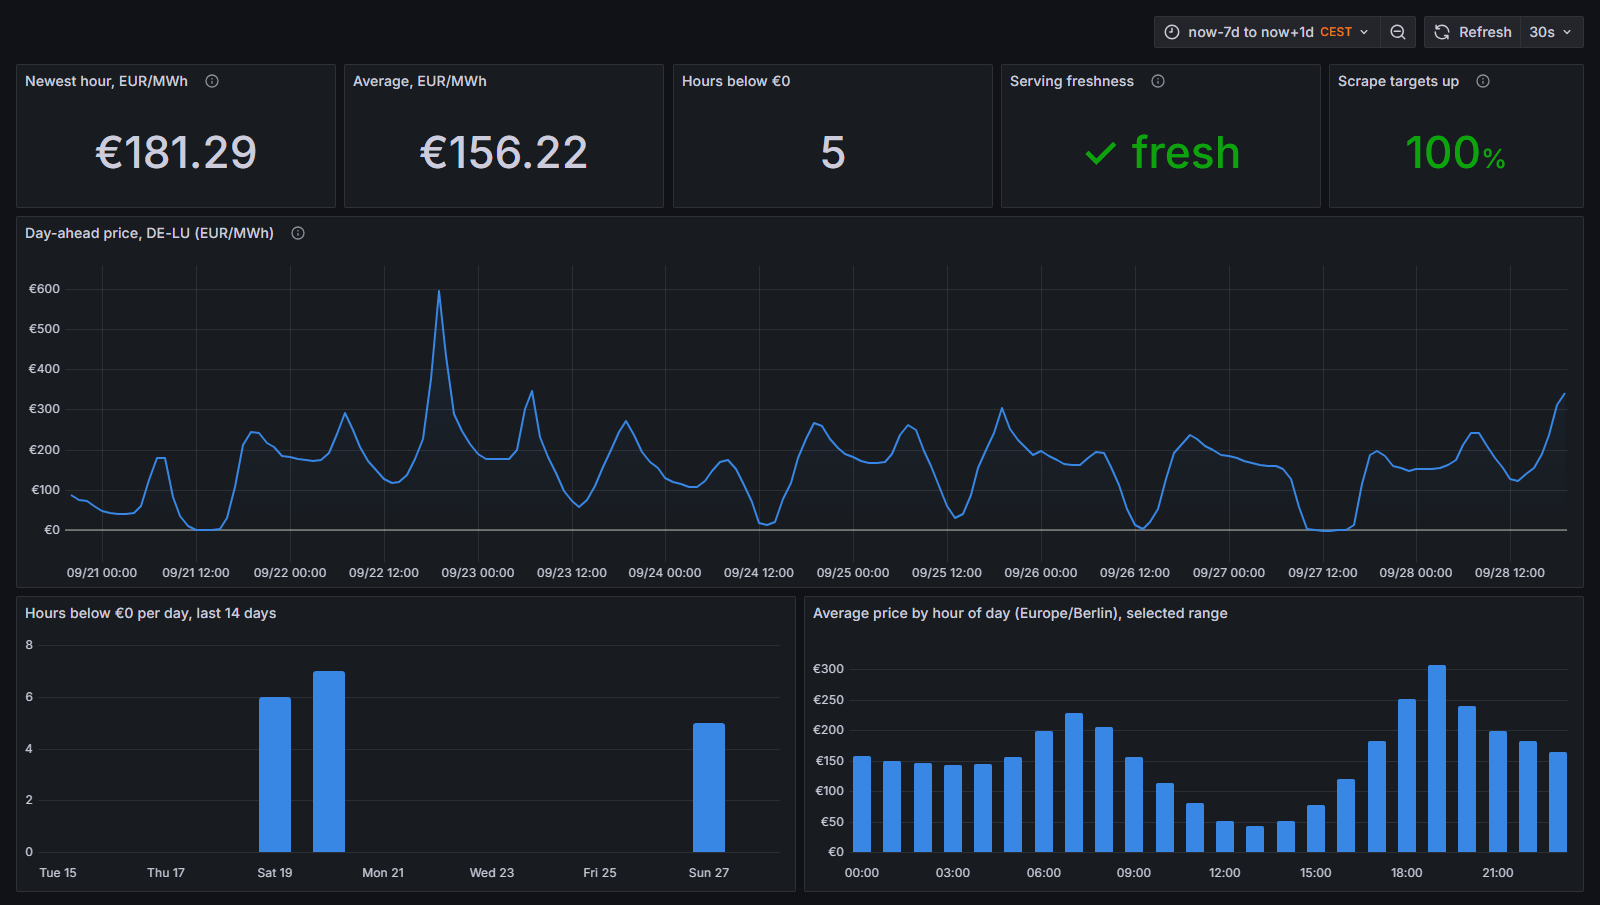
    PG --> G["Grafana"]
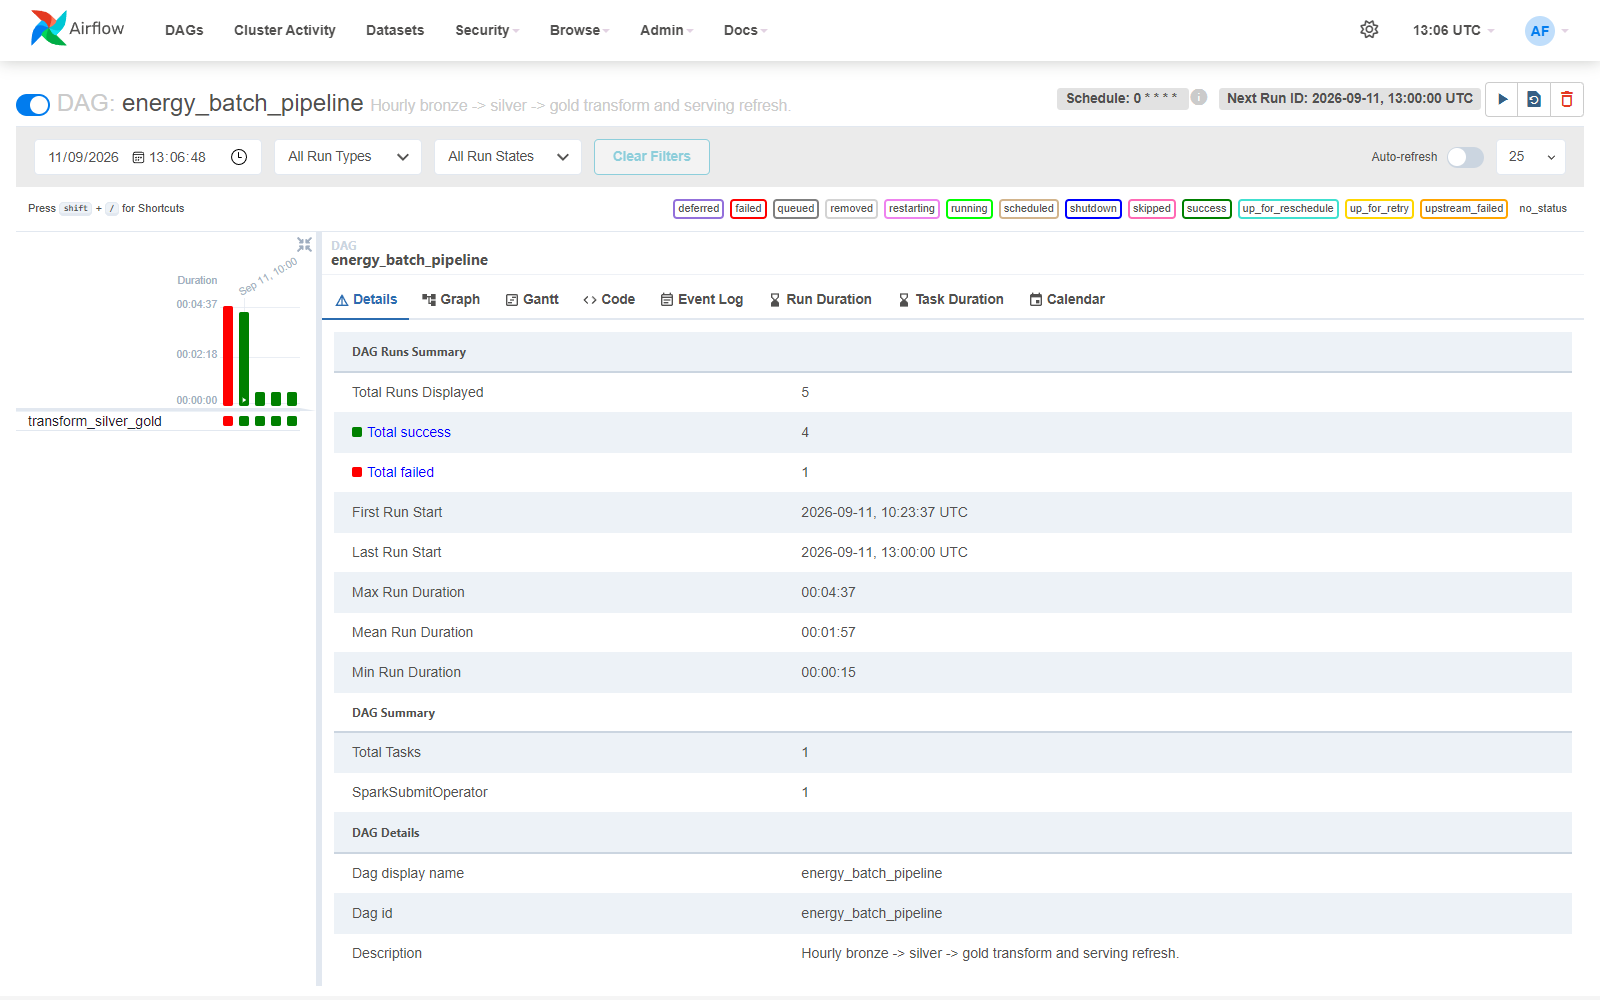
    A["Airflow"] -. hourly transform .-> T
    A -. daily backfill .-> B
    A -. daily compaction + snapshot expiry .-> SI
SMARD.de (Bundesnetzagentur), DE-LU day-ahead, published hours only (latest 2026-10-18 16:00 UTC) - rendered 2026-10-18 16:40 UTC
| Window | Avg EUR/MWh | Min | Max | Negative hours |
|---|---|---|---|---|
| Last 24 h | 175.55 | 141.14 | 234.93 | 0 (0.0 %) |
| Last 7 days | 183.24 | 95.73 | 295.58 | 0 (0.0 %) |
| Last 14 days | 158.08 | 0.00 | 382.32 | 0 (0.0 %) |
| Extremes (last 14 days) | When (Europe/Berlin) | Price |
|---|---|---|
| Cheapest | Sat 10 Oct 13:00 | 0.00 |
| Priciest | Tue 06 Oct 19:00 | 382.32 |
| Split (last 14 days) | Avg EUR/MWh | Hours |
|---|---|---|
| Weekdays | 170.27 | 240 |
| Weekends | 125.92 | 91 |
Full analysis and charts: analysis/findings.md, make bi, make charts.
Public energy-news headlines classified into topics by classifier.dev; unrelated headlines are filtered out.
| Energy topic (latest 95 headlines) | Headlines |
|---|---|
| policy and regulation | 23 |
| renewables | 22 |
| batteries and storage | 15 |
| companies and projects | 12 |
| power prices and markets | 9 |
| grid and infrastructure | 4 |
| gas | 2 |
| hydrogen | 2 |
6 of 95 headlines were general news and filtered out.